Modern businesses generate a large amount of data every day, from sales and inventory to finance and customer interactions. However, data alone is not enough unless it is organized into meaningful insights. This is where Odoo dashboards become an essential business tool. They transform complex business information into easy-to-read charts, graphs, and reports, helping managers make informed decisions quickly.
For anyone new to the platform, understanding how Odoo dashboards work for beginners is the first step toward using business data more effectively. Instead of manually reviewing multiple reports, beginners can monitor key business metrics from one centralized location.
What Are Odoo Dashboards?
Odoo dashboards are interactive reporting screens that display important business information in a visual format. They gather data from different Odoo modules and present it using charts, tables, graphs, and performance indicators.
Businesses can monitor various departments through dashboards, including:
- Sales
- Accounting
- Inventory
- Manufacturing
- Human Resources
- Customer Relationship Management (CRM)
- Purchasing
- Projects
Rather than opening multiple reports individually, users can view all essential business metrics from a single dashboard.
How Odoo Dashboards Improve Business Insights
One of the greatest strengths of Odoo dashboards is their ability to turn raw business data into meaningful insights. Managers no longer need to search through spreadsheets or lengthy reports to understand business performance.
Dashboards provide real-time visibility into important business operations, allowing organizations to:
- Monitor revenue performance
- Track expenses
- View inventory levels
- Measure employee productivity
- Analyze customer behavior
- Follow sales trends
- Identify operational bottlenecks
This visibility enables faster and more confident business decisions.
Understanding How Odoo Dashboards Work for Beginners
Learning how Odoo dashboards work for beginners is easier than many people expect because the platform is designed with a user-friendly interface.
The basic workflow includes several simple steps.
Data Collection
Every transaction performed inside Odoo generates valuable business data.
Examples include:
- Sales orders
- Purchase orders
- Customer invoices
- Vendor bills
- Inventory movements
- Employee attendance
- CRM activities
The dashboard automatically gathers information from these modules.
Data Processing
After collecting the data, Odoo organizes it into meaningful categories. Instead of displaying raw numbers, the system groups related information together for easier analysis.
For example:
- Monthly sales
- Outstanding invoices
- Inventory valuation
- Customer acquisition
- Purchase expenses
This organization helps users understand business performance at a glance.
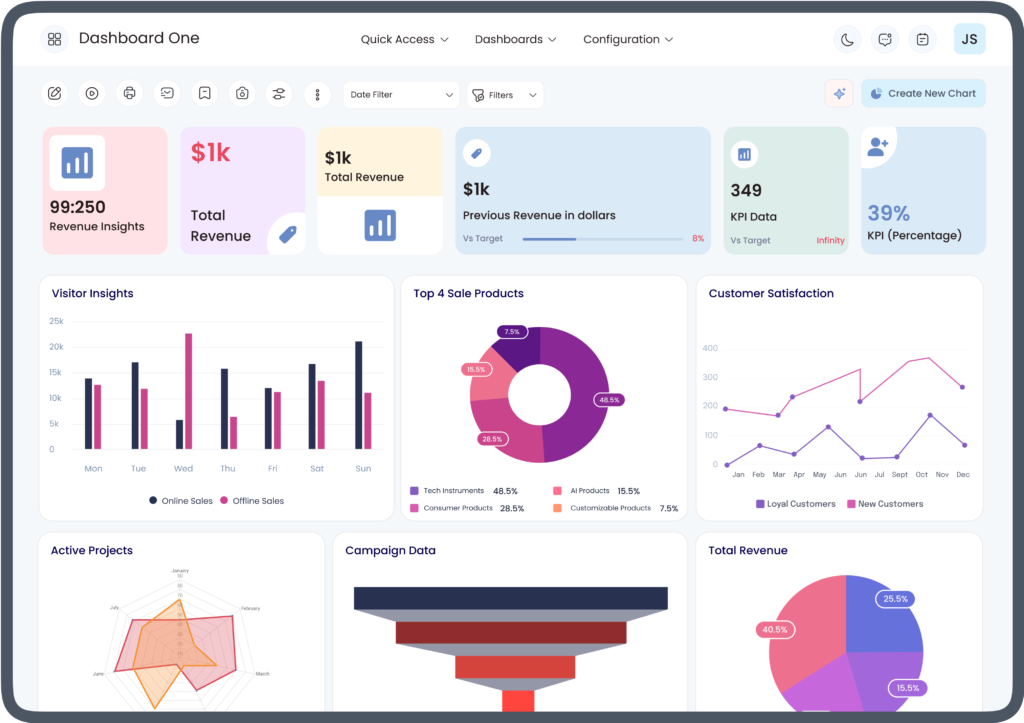
Data Visualization
The processed information appears in visual formats such as:
- Bar charts
- Pie charts
- Line graphs
- KPI cards
- Tables
- Performance indicators
Visual reports make it easier to identify trends and compare business performance over different periods.
Key Features of Odoo Dashboards
Businesses use Odoo dashboards because they offer several valuable features.
Real-Time Reporting
Dashboard information updates automatically as new transactions occur.
This allows businesses to monitor:
- Daily sales
- Current inventory
- Financial balances
- Pending invoices
- Customer activities
Real-time reporting reduces delays in decision-making.
Customizable Layouts
Every business has different reporting needs.
Odoo allows users to customize dashboards by:
- Adding widgets
- Removing unnecessary reports
- Rearranging charts
- Selecting preferred KPIs
- Creating department-specific views
Customization ensures users only see the information most relevant to their roles.
Interactive Filters
Users can filter reports by:
- Date
- Employee
- Department
- Product
- Customer
- Region
- Salesperson
These filters make detailed business analysis much easier.
Benefits for Beginners
One reason many organizations appreciate learning how Odoo dashboards work for beginners is the simplicity of the interface.
New users can quickly understand business operations without needing advanced reporting skills.
Some beginner-friendly advantages include:
- Easy navigation
- Clear visual reports
- Minimal technical knowledge required
- Simple filtering options
- Quick access to key information
These features reduce the learning curve for employees who are new to enterprise software.
Sales Performance Monitoring
Sales teams benefit greatly from dashboard reporting.
Sales dashboards commonly display:
- Total revenue
- Sales by product
- Sales by region
- Top-performing sales representatives
- Monthly sales growth
- Customer orders
- Quotations
Managers can immediately identify strong performance areas and those requiring improvement.
Financial Insights
Finance departments rely on Odoo dashboards to monitor important financial information.
Typical financial metrics include:
- Income
- Expenses
- Cash flow
- Outstanding invoices
- Vendor payments
- Profit analysis
- Budget tracking
Having financial information in one location improves planning and financial management.
Inventory Management Insights
Inventory dashboards help businesses maintain healthy stock levels.
Common inventory metrics include:
- Available stock
- Low inventory alerts
- Incoming shipments
- Outgoing deliveries
- Warehouse movements
- Inventory valuation
Real-time inventory visibility supports better purchasing and stock control decisions.
Customer Relationship Insights
CRM dashboards provide valuable information about customer interactions.
Businesses can monitor:
- New leads
- Opportunities
- Conversion rates
- Customer communications
- Sales pipeline
- Follow-up activities
These insights help improve customer engagement and sales performance.
Human Resources Reporting
HR dashboards simplify workforce management by displaying employee-related information.
Examples include:
- Attendance
- Leave requests
- Recruitment progress
- Employee performance
- Payroll summaries
- Department statistics
Managers gain a better understanding of workforce operations without generating multiple reports.
Manufacturing and Production Monitoring
Manufacturing companies use dashboards to oversee production activities.
Production dashboards may include:
- Work orders
- Machine utilization
- Production schedules
- Material consumption
- Manufacturing costs
- Completed products
These reports improve production planning and operational efficiency.
Tips for Beginners Using Odoo Dashboards
Learning how Odoo dashboards work for beginners becomes much easier by following a few practical recommendations.
Start with Default Dashboards
Default dashboards already contain useful reports for most business operations.
Beginners should become familiar with these reports before making customizations.
Learn Basic Filters
Filtering reports by date, department, or employee provides deeper insights without creating new reports.
Focus on Key Performance Indicators
Instead of monitoring every available metric, beginners should identify the KPIs that matter most to their role.
Customize Gradually
As users become more comfortable with the platform, they can add new charts, remove unnecessary widgets, and personalize their dashboards.
Common Mistakes Beginners Should Avoid
New users sometimes make avoidable mistakes while learning dashboard reporting.
Common examples include:
- Displaying too many widgets
- Ignoring real-time updates
- Focusing on unnecessary metrics
- Forgetting to apply filters
- Creating duplicate reports
- Overcomplicating dashboard layouts
Keeping dashboards simple makes business insights easier to understand.
Why Businesses Rely on Odoo Dashboards
Organizations choose Odoo dashboards because they provide a centralized view of business performance. Instead of collecting reports from multiple departments, managers can monitor every important metric from one location.
This centralized reporting improves communication, supports informed decision-making, and allows businesses to respond more quickly to operational changes.
Conclusion
Understanding how Odoo dashboards work for beginners helps organizations unlock the full value of their business data. By converting complex information into clear visual reports, dashboards make it easier for employees and managers to monitor operations, identify trends, and make informed decisions.
Whether tracking sales, finance, inventory, customer relationships, or employee performance, Odoo dashboards provide a practical solution for improving business insights. As beginners gain experience with the platform, they can customize dashboards to meet their specific reporting needs, creating a more efficient and data-driven business environment.